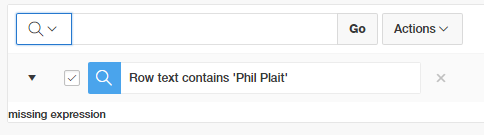
Showing posts with label Debugging. Show all posts

Monday, 10 September 2018

Enhancing the APEX Error Handling Function with Logger

Many, many moons ago, I created an error handling function for Oracle APEX, just like the original sample provided by Patrick Wolf for the 4.1 error handling feature. You'll probably find a strong correlation between the two events.

OK, now what?
We normally see this if an exception was propagated within a PL/SQL Dynamic Action.
In this case I thought it was time for a little upgrade.

I noticed the sample code, now part of the APEX_ERROR documentation, suggested including a reference ID, perhaps from some logging package.
Conveniently, we use such a package, a popular one among the PL/SQL community called Logger.


I glanced through the package specification, and for a moment I thought it was missing a function that returned the new log ID.

I found a procedure with an OUT parameter instead, so here I log some contextual information about the error.
logger_user.logger.ins_logger_logs(
    p_unit_name => 'error_handler' ,
    p_scope => 'apx_util.error_handler' ,
    p_logger_level => logger.g_error,
    p_extra => p_error.component.name
              ||'~'||p_error.component.type
              ||'~'||p_error.message,
    p_text => 'apx_util.error_handler()',
    p_call_stack => dbms_utility.format_call_stack,
    p_line_no => null,
    po_id => l_reference_id
);
Now the user has some context to report. I figured the wording could be softened a little, too ;p

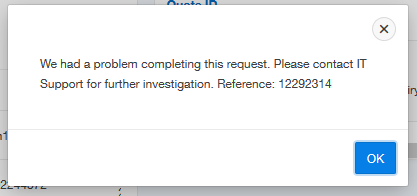
Standard error message, with reference

So if we were to execute the following SQL, we could see further details.
select time_stamp, module, client_identifier, extra
from logger_user.logger_logs
where id = 12292314;
The log message prior to this ID may also help to provide clues as to the problem.

SQL results, slightly redacted

I also wanted to add some convenience to the developer, so I added this same information to the error popup, but only when an active session is also present within the App Builder (or some special privilege present).

Immediate context for the developer

This is toggled by checking a built in substitution string (or my application item). I note this built-in was only documented from 18.1, but I believe it has been present for a while. It's certainly returns a value in 5.1.
l_result.message := 'We had a problem completing this request. '||
    'Please contact IT Support'||
    ' for further investigation. Reference: '||l_reference_id
    ||case when v('F_SEC_DEV') = 'Y' -- anyone with privilege
    -- or has builder open (from oos_util_apex.is_developer)
    or coalesce(apex_application.g_edit_cookie_session_id
               ,v('APP_BUILDER_SESSION')) is not null then
      ' Dev only: '||p_error.component.name
      ||' ~ '||p_error.component.type
      ||' ~ '||p_error.message
    end;
This brightened the day of some of my colleagues.

Friday, 28 October 2016

APEX Survey Results: Instrumentation Thoughts

This question in my 2015 survey is related to question 7 regarding instrumentation.

Q8: Do you have any thoughts you'd like to share on instrumentation?

I left this open for people to add a free-text response. Here are some worth highlighting, though it was hard to choose since so many people had something to add.

a) How would it help me?

Have a read of this post to get an idea of how the debug output can help solve problems.

b) It's not optional

I agree, it should be baked into your code.

c) An application is not just building, but also managing after deployment. To reduce the cost of the second fase (sic) instrumentation is a must

Another perspective on what instrumentation is all about.

d) Nobody instruments enough ....

Well, I think you could probably have too many logs.

e) Not enough planning goes into instrumentation in general.

Planning is an interesting point. While we could plaster our code with debug logs, this isn't necessarily going to help debugging your code, particularly when you need to further sort the wheat from the chaff.

Once you've decided on a framework, start thinking about standard patterns such as noting start/end of procedures; incoming/outgoing parameters; the varied level of detail you may need; how you can turn it on/off; how errors are highlighted and treated.

Any other factors you think are worth mentioning in regard to planning?

f) Please make Debugging more smoother and documented. An idea can be to create a packaged application to showcase debugging.

Something for the APEX development team to consider.

g) Instrumentation should point out the exact place where error is occured (sic). It should not be overhead for the APEX application and there should be a switch to turn it on/off.

Back in APEX 3.x, debugging was displayed where relevant, within the rendered page itself. It looked awkward and was hard to decipher. Any code is overhead, but the risk/benefit equation outweighs the cost. APEX debugging can be turned on/off, and some logging libraries provide options for granular logging.

h) ... Also debugging apex_collections is somehow hard today ...

Constructs relating specifically to a particular session (such as collections) can be tricky to detail, but with careful planning you should be OK. It may be useful to output a collection count at key locations. You could have a little library that looped and logged key columns from the collection. And the Session link in the Developer Toolbar allows you to see collection contents naturally.

i) I wish I'd known about or used some of the instrumentation methods above long ago when I built my first Apex apps.

I think that comment right there should be a warning to all those who haven't started yet.

j) The CREATE ANY CONTEXT privilege requirement in Logger is a pain.

Sounds worth airing, but I'm pretty sure the benefits outweigh whatever pain that might be.

k) asdfasdfasfd

It seems even cats have opinions on the topic.

l) do it! use whatever tool fits your needs, but use something!

I'll finish with that one.

Does anyone recognise their comment? I didn't want to name anyone without asking.

Friday, 9 September 2016

APEX Survey Results: Workspace Activity Log

This question in my 2015 survey relates to built-in instrumentation.

Q7. Do you utilise apex_workspace_activity_log (for monitoring/reporting application usage)?

Yes (90)  47%
No (102) 53%

This log table reports details of all page rendering and AJAX process calls. I really like this information, though I would like to be able to add to the output things such as
sys_context('userenv', 'server_host')

In addition to the Monitoring pages you'll find in the APEX administration section, I've built a few pages that report on this information in my own particular way. This allows me to monitor behaviour and identify bottlenecks. More information to come on this since it's fuelling a presentation I'm writing on charting in APEX 5.1, so stay tuned.


Friday, 2 September 2016

APEX Survey Results: Instrumentation / Debugging

This question from my 2015 survey may pique curiosity among some APEX developers.

Q6: How do you instrument your code?


Hopefully those in the 22% who do not add instrumentation just didn't understand the question.

Instrumentation is another term for adding debugging information to your code. There is plenty of commentary on this topic and done right it can make tracking down problems a breeze.

It can be as simple as knowing when a procedure was called, and with what parameters. Take the following procedure definition with instrumentation (debug logs) added.
procedure xyz(p_in number) is
begin
  debug('start xyz');
  debug('p_in:'||p_in);

  -- do stuff

  debug('end xyz');
end;
 I think you're essentially coding blindfolded without it. You could only infer this procedure was executed because of whatever it does, and if something goes wrong how do you know what was passed in? Where did it get up to? Did it execute at all?

Imagine using the database without the ALL% dictionary views. They're essentially instrumentation to your database. Tom Kyte has some particularly good talks on the topic, and a few chapters in his various books.

It's very much a PL/SQL thing, but since APEX pages are generated via PL/SQL, there is a natural solution with the supplied apex_debug package. Any process can add information to the APEX debug log, which is only collected while debug is on.

There is no reason why you shouldn't instrument any PL/SQL, and have the granular control to turn on/off at will. Libraries are available to make this job easier.

You may have heard Logger talked about at conferences. It's a community developed library, well, mostly driven by some key players. It's had a few homes (remember google code?) but is now found on GitHub:
github.com/OraOpenSource/Logger

PL/SQL Logger can be found here, if you want to compare solutions or look for ideas, read other people's PL/SQL.
https://sourceforge.net/p/plsqllogger/wiki/Home/

Despite recommending it a few times, I've never actually used Logger on-site (sorry Martin). For quite some time I've had a basic infrastructure of my own that has worked fine, using the same premise. That being said, it's on my list to convert/upgrade when the timing is right. Partially because I've followed it's progress, know who wrote it, and inspected the code. I look forward to benefits some extra features will bring.

The next few questions also relate to instrumentation, so stay tuned.

Thursday, 25 August 2016

How to debug stuff in Oracle APEX

Recently a fine young gentleman, who shall remain nameless (let's call him Jerry), asked for some assistance he was getting with an error in Oracle APEX.

He had done all the right things in regard to debugging the problem, but didn't know enough about APEX to know which settings to investigate.

I think developers new to APEX need the occasional post like this to give them an idea on how to start looking into a problem, so I hope you found this knowledge helpful in squishing bugs in future.

The problem.

An associate of Jerry's converted a classic report to an interative report. However, when using the search bar to add a filter, the error "missing expression" was shown instead.


We could be fairly certain it's the filter we added that caused the problem, but that's built by the APEX engine. What can we do but perhaps run the page in debug mode to look for clues.

developer toolbar


Jerry enabled debug mode in the developer bar, which refreshed the page, collecting information about the rendering processes within the page. Clicking on open debug, then drilling into the the recent debug entry, using ctrl-F to find the error and you'll see a result like this.

Click/tap to embiggen

The brackets are there, but there's nothing in the middle, hence "missing expression". Jerry told me about this and wondered how this could come to be?

The Hint

Jerry said they recently expanded the capacity to filter stuff on that report, for my benefit, he says... anyway, that's a lead we can follow through on.

It turns out each column in an Interactive Report is configurable at a fairly granular level, and it turns out all columns had the ability to filter disabled.

Isn't it so great we can manipulate 8 columns at once like this?


If a few columns were set as searchable in this fashion, the debug would report a statement that looked like this.
select EMPNO,
       ENAME,
       JOB,
       MGR,
       HIREDATE,
       SAL,
       COMM,
       DEPTNO
  from EMP
)  r
where ((instr(upper("ENAME"),upper(:APXWS_SEARCH_STRING_1)) > 0
    or instr(upper("SAL"),upper(:APXWS_SEARCH_STRING_1)) > 0
))
) r where rownum <= to_number(:APXWS_MAX_ROW_CNT)

Note your own PL/SQL can also contribute to this debug log using the apex_debug package.

But, how?

Anyway, how could Jerry know to look there? Unfortunately the debug machine can't do all our work and tell us what to check. I guess knowing exactly where to look is when APEX developers get paid the foldy notes, in knowing what sort of settings to check out first.

Through experience I guess I had a hunch on where to look and how to get there. Adding to that, any errors you may receive with Interactive Report filters, try repeat the filter for just one column instead of 'row text contains'. I find issues are often isolated to one particular column.

I normally start with the related region if I'm not sure where to start, though these settings are mostly oriented to the region framework, regardless of the widget inside the region - report, chart, plugin etc.

People new to the Page Designer often forget the 'Attribute' node under the columns. This is where you find settings specific to the region type you've chosen.

IR search bar controls are fairly granular, and I remembered that IR columns also had some options, and seeing 'Filter' gave it away for me.

Will we always have a job?

Back to the concept that computers can't do it all. I think us software developers have got it good, because we're the ones who need to design the AI to solve problems without humans. We'll be one of the last jobs to go, right?

Friday, 17 May 2013

APEX Easter fun

This isn't really an easter egg, just more of a mild bug that makes you think - hopefully a little more about your own applications.

If you type in "0" in the page navigation bar, it takes you to the typical global page / page zero for desktop.
In the component view, instead of displaying page processing and shared components, it displays application level components - items, process, computations; and an "About" region in the third column, above recently edited pages. Useful stuff...

If you type "-0", it renders page zero detail as if it were a normal page.

If you type "-1", or any other negative number,
- in 4.2.1 it takes you into a horrible "no data found" that's annoying to recover from, similar to if you type a positive page number that doesn't exist
- in 4.2.2 it handles it a little more elegantly, a little better than it did pre 4.2 - displaying no page detail.

Harmless "fun".

Wednesday, 30 January 2013

Dynamic Action hidden False actions

I thought I'd share what's quite literally a hidden problem I experienced in 4.1.1 involving dynamic actions.

The project used hundreds of dynamic actions, and often I would copy them between pages.

Something to watch out for, however, is the cleaning up APEX does with dynamic actions in it's own builder. I've notice in the past the meta-data I saw in dictionary views contained stale information, hidden after no longer being needed when adjusting some other attribute - like condition types.

By looking at the stock debug, I noticed that a good portion of my page render time was for dynamic action plug-ins. One of these was for the notification plug-in supplied by Oracle (gritter). Over time the number of notifications on the Global Page Zero had grown - but in my case could be consolidated using &ITEM. substitution syntax to define the title & message.

But there were still more instance of the gritter notification in the rendered page sauce than was expected, so I looked a little harder...

In regard to dynamic actions, beware the non-condition - in past I must have copied this from another action; removed the event "when" condition; the false action region was hidden from the developer, but and a false action remained - causing unnecessary rendering of a plug-in, hence performance issue. What a paragraph, hope that made sense!

All I saw when editing the item were the True actions.
True actions for DA with no JavaScript "when" event condition
By changing the when condition to "equal to", I was able to see the previously hidden False action.
screenshot actually from 4.2
Sure enough - there it is
A hidden False action, displayed when condition restored
So I had a few false actions to remove that would never fire.

You can find such cases yourself with the following SQL - I used this query to check for other issues.
select * 
from   apex_application_page_da d
-- no when condition present
where when_condition is null 
--and dynamic_action_name = ''
and application_id = 104
and page_id = 0
and exists  -- a false condition
  (select null 
   from apex_application_page_da_acts a
   where a.dynamic_action_id = d.dynamic_action_id
   and dynamic_action_event_result = 'False')
/

I saved about .05 seconds each plug-in render, so notifications in page zero added up over time. I saved about third of a second in my clean up of these alone. Plus I was finding other minor performance gains - they all add up!

Scott

Wednesday, 16 January 2013

Using SQL to view APEX session state

There are times (mobile development, multi-browser development, most Fridays) when checking out what's in session state isn't as easy as clicking a button in the developer toolbar.

One option is to utilise provided data dictionary views and a supplied API.
select item_name, component_comment
      ,apex_util.get_session_state(item_name) session_value
from  apex_application_page_items
where application_id = :APP_ID
and   page_id        = :APP_PAGE_ID
Update - this query locates values for Page Items, you can also use apex_application_items to view Application Item values. I used both in my debug page (thanks, Marko)

You could include this as a link to a popup from the navigation bar, or a region on a global page (page zero) that is conditionally displayed using a build option.

You can also interrogate session state using SQL in your favourite IDE, but there's a catch.

If you have access to objects in the APEX owner, you can run a query like this to view session state detail:
select s.remote_addr
      ,d.flow_id app_id
      ,i.display_sequence seq
      ,d.item_name, d.item_value_vc2 item_value
      ,d.item_filter
      ,d.session_state_status
      ,d.is_encrypted
      ,s.cookie the_user
      ,s.security_group_id
      ,d.flow_instance
      --,d.* 
from apex_040200.wwv_flow_data d
    ,apex_040200.wwv_flow_sessions$ s
    ,apex_application_page_db_items i
where d.flow_instance = s.id
and   i.item_id(+)    = d.item_id
--and   s.security_group_id = 100001 -- workspace group ID 
--and   item_name is not null
and   flow_instance   = 4359890239697682 -- session ID
and   flow_id < 4000 -- ignore dev builder et al
order by flow_id, i.display_sequence, d.item_name
In my local laptop I have this query handy in SQL Developer, replacing the session ID in the highlighted line to whatever is shown in my browser's address bar. If you aren't talking about your local laptop, and have a good relationship with your DBA, perhaps this could be turned into a view
CREATE VIEW apex_040200.apex_session_state AS...

Then grant SELECT on the new view to your schema owners, and create a synonym. Note, if any item is set to encrypted, you still won't be able to read the item value. This view was also particular to 4.2, it was previously d.item_value -- _vc2

At the end of the day, there is more than one way to check out session state.

Scott

ps - on a related note, here is another way to check out the alert log
Exposing the Oracle Alert Log to SQL - Neil Chandler

Friday, 11 December 2009

Apex Application Alterations

Here is a tidbit I noticed that may be useful to someone.

Sometimes there comes a need to compare two applications to determine differences. Typically, this would be comparing an older version of the same application to see what has been changed (and try to determine why!)

Doing this via a text comparison of the export is tough. A simple compare of text files in TextPad gave me 5000 lines of differences for a copy of an application where I made one change! This would of course be due to the differences in IDs for all the objects. Perhaps an expert in text comparison tools may suggest an alternative there.

The Application Express builder provides a comparison tool for you. Once you have one of the applications selected, click on the Application Reports link in the Task List.

One set of application reports is "Cross Application"


There are two comparison reports, as opposed to the attribute listings:


Now this is an output of differences between my two applications, one was a copy where I made an attribute change of an item in a form.

The Show Details checkbox option does little to illustrate the difference Apex found, but the report can be a good starting point to debugging and locating a problem you may have.

In this case the Application Attribute difference is obvious - the application alias would have changed.
Page 7 relates to my change, so it seems to be highlighting some difference in the page itself, in addition to the item I modified. If the algorithm is using some form of checksum to make the comparison, this is not exceptional.
I didn't look into the page 35, where there is a blob displayed, nor the page templates.

If this is a task you may perform semi-regularly, they may be anomalies/expected behaviour you come to expect from the comparison and learn what is safer to ignore.