
He had done all the right things in regard to debugging the problem, but didn't know enough about APEX to know which settings to investigate.
I think developers new to APEX need the occasional post like this to give them an idea on how to start looking into a problem, so I hope you found this knowledge helpful in squishing bugs in future.
The problem.
An associate of Jerry's converted a classic report to an interative report. However, when using the search bar to add a filter, the error "missing expression" was shown instead.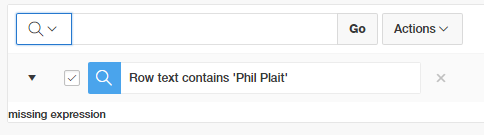
We could be fairly certain it's the filter we added that caused the problem, but that's built by the APEX engine. What can we do but perhaps run the page in debug mode to look for clues.
 |
| developer toolbar |
Jerry enabled debug mode in the developer bar, which refreshed the page, collecting information about the rendering processes within the page. Clicking on open debug, then drilling into the the recent debug entry, using ctrl-F to find the error and you'll see a result like this.
 |
| Click/tap to embiggen |
The brackets are there, but there's nothing in the middle, hence "missing expression". Jerry told me about this and wondered how this could come to be?
The Hint
Jerry said they recently expanded the capacity to filter stuff on that report, for my benefit, he says... anyway, that's a lead we can follow through on.It turns out each column in an Interactive Report is configurable at a fairly granular level, and it turns out all columns had the ability to filter disabled.
 |
| Isn't it so great we can manipulate 8 columns at once like this? |
If a few columns were set as searchable in this fashion, the debug would report a statement that looked like this.
select EMPNO,
       ENAME,
       JOB,
       MGR,
       HIREDATE,
       SAL,
       COMM,
       DEPTNO
  from EMP
)  r
where ((instr(upper("ENAME"),upper(:APXWS_SEARCH_STRING_1)) > 0
    or instr(upper("SAL"),upper(:APXWS_SEARCH_STRING_1)) > 0
))
) r where rownum <= to_number(:APXWS_MAX_ROW_CNT)
Note your own PL/SQL can also contribute to this debug log using the apex_debug package.
But, how?
Anyway, how could Jerry know to look there? Unfortunately the debug machine can't do all our work and tell us what to check. I guess knowing exactly where to look is when APEX developers get paid the foldy notes, in knowing what sort of settings to check out first.Through experience I guess I had a hunch on where to look and how to get there. Adding to that, any errors you may receive with Interactive Report filters, try repeat the filter for just one column instead of 'row text contains'. I find issues are often isolated to one particular column.
I normally start with the related region if I'm not sure where to start, though these settings are mostly oriented to the region framework, regardless of the widget inside the region - report, chart, plugin etc.
People new to the Page Designer often forget the 'Attribute' node under the columns. This is where you find settings specific to the region type you've chosen.
IR search bar controls are fairly granular, and I remembered that IR columns also had some options, and seeing 'Filter' gave it away for me.